


Blog
Air pollution modelling: what is it and what can it tell us?
Article Details
Last Updated
14 September 2025
Published
11 August 2016
Category
Outdoor
Introduction
Ever looked at a chimney or stack and wondered how far the plume has an impact? Ever sat in traffic and wondered what the impact of all the vehicles was and how far away that impact was felt?
Well air pollution models can help answer those questions.
Air pollution modelling in a nutshell
Air pollution modelling is the term used to describe using mathematical theory to understand, or predict the way pollutants behave in the atmosphere.
Modelling can be used to run scenarios, to test theories and understand environmental impact under different emission rates, weather and development scenarios. There are lots of different methods and techniques, but the goal is always the same – make an assessment of pollutant impact over a given area using an existing set of data. To do this we make some assumptions, we use some rules, and we add some data.
An assumption is something we assume to hold true in all model conditions. So we assume that the atmosphere behaves in a predictable way, and that plumes behave in a known way.
We use some rules: like emission factors or emission rates – these are things we know – like the volume and composition of an emission source, or the reactions emissions undergo in the atmosphere. Finally we add some data – most commonly meteorological and terrain data.
The model is only as good as the data we feed it.
Advantages of modelling
Air pollution modelling has a few advantages.
Firstly, you can assess a completely hypothetical situation before it occurs. For example, an industrial operation may propose a new facility. In their design they might specify a stack of several meters tall, emitting pollutants from a known process. Using a model the emissions can be roughly quantified.
These emissions can be fed into a model, which can predict the emissions spatially around the source. This analysis might show that concentrations are too high based on a given operating mode, or might show that under certain wind conditions the concentrations in a residential area are unacceptably high.
The power of this is that the problem can be solved before it even exists. Often, industrial emitters need to demonstrate their environmental impact. The severity of their impact dictates whether their emissions are allowed, or need further permitting.
Similarly, a model can be used to predict alternative situations. For instance, the facility may decide that it wants to upgrade its infrastructure, changing fuel or installing better, more effective scrubbers. The emissions given these changes can then be quantified. These are called scenarios.
Weaknesses of models
A well known quote states that ‘all models are wrong but some are interesting’. Models are only as good as the data that you put into them, and they don’t always reflect reality with total accuracy. They are however ‘interesting’ in that you can answer questions and test scenarios which may be either impossible to test, like the impact of a new road, or factory.
They can also be used to assess questions which are too expensive to test with data collection – like air quality at a regional or global scale.
Models rely on accurate inputs. Meteorological data needs to be treated with particular care, as wind speed and direction plays a pivotal role in dispersion. Pre-processed data are available on line. Guidance is available on line from many regulators, covering best practice, which in some cases includes emission factors and model parameters, as often these are controlled by regulators. Here’s an example.
Types of models
There are several different types of air quality models, all used for differing purposes. The most common models are broadly known as Atmospheric Dispersion Models (ADM). These models use mathematical assumptions about the way that the atmosphere behaves, to assess the impact of emissions.
Typically, these types of models are used to model emissions from a fixed point, like a stack of an industrial facility.
One of the most widely-used and respected ADMs is CALPUFF . CALPUFF uses 3 major inputs – a meteorological model, a dispersion model and a post processing package, and is a preferred USEPA model. CALPUFF is complex, and is therefore very powerful when used correctly.
It can be used at a wide range of scales – from a few square kilometers to several hundred. It can deal with complex terrain and can handle complex atmospheric chemistry processes. CALPUFF outputs its data in a range of ways – perhaps most usefully as a ‘grid’ which can easily be visualized in Geographic Information Systems (GIS) packages, or proprietary software.
A second widely used model is AERMOD. AERMOD is also USEPA approved, but differs slightly in that it assumes a steady state – i.e. continuous emissions and environmental factors, where as CALPUFF is non-steady state and can be tuned for changes in environmental conditions, like weather.
Generally, CALPUFF is used for smaller scale assessments (less than 10KM2) and AERMOD for larger, more regional projects.
ADMs can also be used at very small scales. CALINE4 is an ADM specifically designed for assessing air quality impacts at roadways or intersections. The module uses a range of traffic and fleet characteristics, and a diffusion equation to assess the impacts of a road at a small scale.
Often this model is used to predict impacts of changing traffic volumes, signal phasing or adding additional lanes to a roadway. Similar models are in use around the world. VEPM, developed in New Zealand, uses real, lab based emissions data to predict emissions from a roadway, and can even predict emissions out to 2040.
Air quality can also be modelled using Land Use Regression (LUR) models. These models differ from ADMs in that the question asked initially is slightly different. With a LUR model, the question is usually “I know something about the air quality at this location, and I know the land use of an area, so how can I use this to predict air quality?”
For example, a study like this one might deploy passive samplers across an area, and then assess how the concentrations relate to vehicle movements, street size or building height. Or, a relationship between vehicle movements and pollutant concentrations can be developed. This approach allows entire cities to be modelled – as has been done in London, New York, and Toronto.
The importance of ground truthing
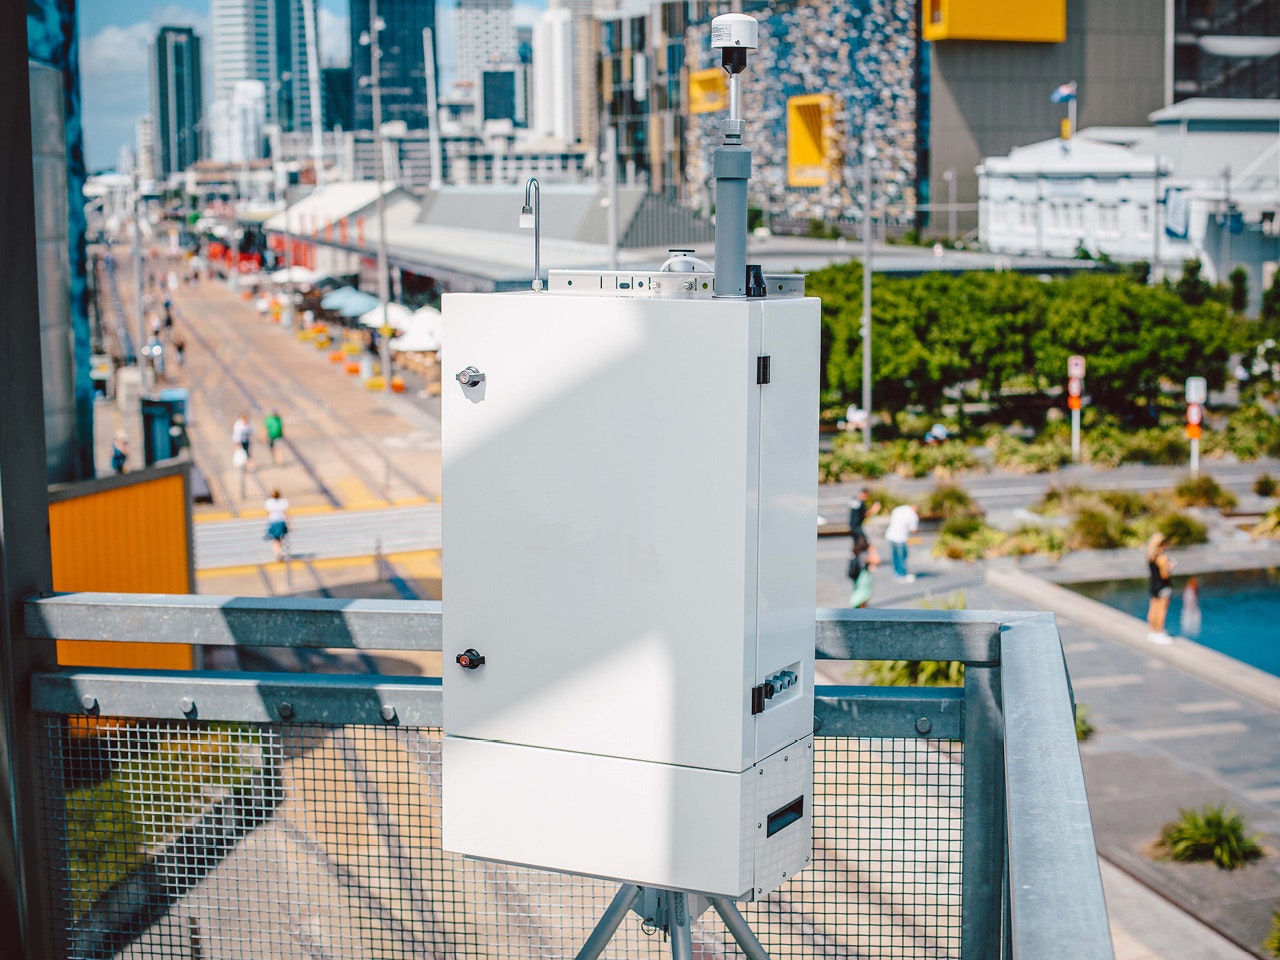
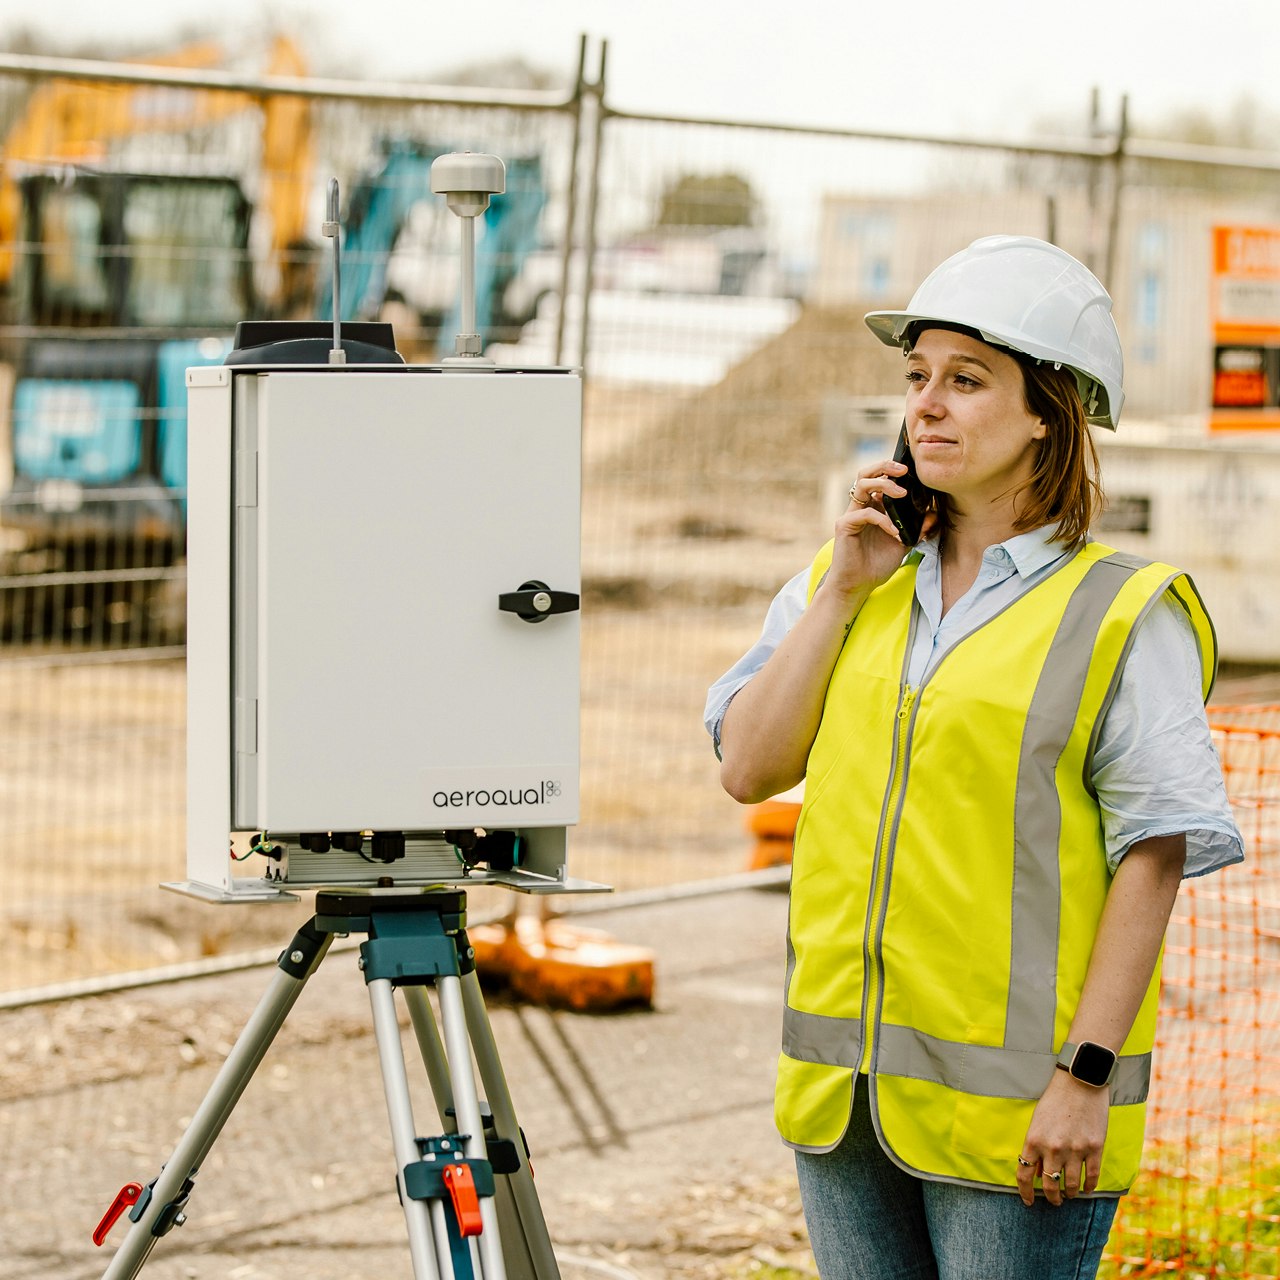
Remember the famous quote? It’s important to understand your model and its weaknesses. Its common practise to test your models accuracy by deploying instruments or collecting more data and comparing the results. Near Reference air quality monitors, like Aeroqual's AQS 1 and AQM 65 are ideal for this purpose.
The small footprint, and ability to measure multiple pollutants at once can allow you to assess your models to a degree not previously possible. The AQS 1 and AQM 65s small size means they are well suited to monitoring in small spaces in cities, with a significantly lower cost of ownership compared to traditional methods.
Related products


Let's talk air quality monitoring
Get in touch to discuss how Aeroqual can help you measure your air quality.