


Blog
Part 2: Methods for monitoring NO2 and PM at construction sites

Article Details
Last Updated
04 April 2024
Published
14 September 2017
Category
Construction
Where were we?
The first blog in this series addressed two critical air pollutants, nitrogen dioxide (NO2) and fine particulate matter (PM), how they occur on construction sites, impact on health and environment, and what monitoring regulations apply.
In this post we discuss the principal methods used to measure NO2 and PM and their relevance to monitoring in the construction industry for compliance purposes, for managing pollution events, and measuring effectiveness of mitigation measures.
The next blog considers when, where and how many air quality monitors to install around a site.
Active vs. passive methods for monitoring NO2 and PM
There are a wide variety of monitoring techniques available to measure NO2 and particulate matter. These include “active” (powered) samplers that continuously measure gaseous pollutants (e.g. NO2 and NOx) and specific dust fractions (e.g. PM10 and PM2.5), to simpler “passive” (unpowered) samplers like diffusion tubes which absorb NO2, and gauges that collect dust deposition for post-analysis.
Active samplers include expensive and sophisticated, automatic analysers that provide real-time, high-resolution measurements of NO2 and PM concentrations. Such instruments are usually operated according to strict QA/QC guidelines and the readings can be directly compared to mandated air quality objectives/limit values Then there are other lower cost automatic analysers that measure real-time concentrations of NO2 and PM which are indicative in comparison to the objectives/limit values. Each technique has advantages and disadvantages, and varying applicability to air quality monitoring at construction sites.
Factors to consider in choosing monitoring methods
Construction site emissions monitoring present unique objectives and challenges for air quality professionals. Some factors to take into account in choosing an appropriate method include:
- Is a reference equivalent method required for legal reasons?
- Are indicative instruments suitable to demonstrate that limit values are not exceeded?
- Is there a requirement to carry out real-time monitoring of PM concentrations?
- Are remote monitoring and SMS/email alerts available for mitigation measures?
- What PM fraction sizes are specified – PM10 only or both PM2.5 and PM10 simultaneously?
- Do NO2 emissions impact on sensitive receptors and require to be measured?
- If an automatic analyser is required, is there access to electrical power and secure sites?
- Are meteorological (wind speed and direction) data available at the site?
- Is monitoring required at multiple site boundaries?
- Do the monitoring sites need to be moveable or permanently fixed?
- What are the technical practicalities and financial implications of the monitoring method?
- Would a monitoring system that integrates NO2 + PM2.5 + PM10 and meteorological measurement be a future-proof investment?
Monitoring methods and applicability for construction sites
The table below is based on technical advice published by the Department for Environment Food & Rural Affairs and the Institute of Air Quality Management.
Nitrogen Dioxide NO2
Method
Advantages
Disadvantages
Chemiluminescent analyser
Continuous real-time data. Reference equivalent method. Readings compare directly with AQ objectives and limits.
High capital and operating costs. Requires power, site security, and careful servicing.
NO2 sensor-based analyser
Continuous real-time data with 1-minute resolution. New generation sensors provide part-per-billion detection. Relatively low cost. Portable. Easy to attach at site boundary. Some analysers combine PM optical methods.
Readings may be subject to cross interference from ozone or variable temperatures and humidity. Some analysers use integrated bias correction to overcome this. Readings are indicative to the limit values. Requires power and security.
Diffusion tube
Low capital and operating costs. Can measure NO2 spatial distribution over wide geographical areas. Require no power supply and minimal training of site staff.
Readings are averaged over long exposures e.g. 1-month. Accuracy is variable. Depends on tube preparation and lab analysis. Need bias-correction to compare with limit values.
DOAS system
Continuous real-time data. Open path multi-gas system gives ‘average’ reading for several pollutants. No inlet manifold required.
High capital cost. Not easily deployed. Readings cannot be compared directly with AQ limits. Fog or snow can affect performance.
Particulate matter (PM)
Method
Advantages
Disadvantages
FDMS analyser
Continuous real-time data with 1-hour resolution. Reference equivalent method. Readings can be directly compared with AQ limits.
Very high capital/operating costs. Requires power, security, and careful servicing. Single fraction size PM10 or PM2.5 depending on inlet.
TEOM analyser
Continuous real-time data with <1-hour resolution. Data can be corrected for loss of semi-volatiles for equivalence to the reference method. High capital and operating costs. Requires power, site security, and careful servicing. Single size fraction only PM10 or PM2.5 depending on inlet. Unlikely due to high cost and operational requirements. May be appropriate for very sensitive sites where specified.
High capital and operating costs. Requires power, site security, and careful servicing. Single size fraction only PM10 or PM2.5 depending on inlet.
Beta attenuation monitor
Continuous real-time data with 1-hour resolution. Reference equivalent method. Readings can be directly compared with AQ limits.
High capital and operating costs. Requires power, site security, and careful servicing. Single size fraction only PM10 or PM2.5 depending on inlet.
Optical PM analyser
Some analysers measure multiple fractions (TSP, PM10, PM2.5) simultaneously, in real-time with 1-minute resolution. Lightweight, portable. Easily attached at site boundary. Relatively low cost. SMS/email alert notifications. Requires little service and maintenance.
PM readings are calculated on particle characteristics which may vary and be subject to “artefacts” e.g. humidity interference during fog. Readings are indicative compared to AQ limit values. Requires power and security.
Filter-based gravimetric
Some samplers are equivalent to the reference method. Readings can be directly compared with AQ limits.
Requires care with filter selection, handling, storage, and QA/QC procedures. High operating costs. Resource-intensive. Time resolution is 24-hour. No real-time data.
Hand-held PM sampler
Real-time data for multiple fractions simultaneously. Easily deployed for walk-over surveys to check effectiveness of mitigation measures.
There may be problems with the detection limit of some sampler types. Readings are indicative only.
Dust deposition gauge
Relatively low cost. Can be easily deployed on site. Requires no electrical power.
Requires lab analysis. Time resolution is weeks or months. No data on short-term events. Trigger thresholds based on historic data only.
Technical guidance for selecting monitoring techniques
In the United Kingdom, the Environment Agency DEFRA provides technical guidance for Local Air Quality Management which approves the use of optical particle monitors for identifying short-term pollution events at construction, demolition or waste transfer sites, and for short term, local campaigns. Many of these instruments have been certified using the Environment Agency’s Indicative instrument certification scheme MCERTS.
The Greater London Authority requires that all major development sites should have continuous air pollution monitoring carried out, along with noise and vibration. PM10 dust monitoring in real-time is required so in the event that higher concentrations are recorded on these monitors the cause is investigated, recorded and mitigation actions taken immediately. The requirement to monitor PM2.5 and NO2 is determined on a case by case basis by the local planning authority depending on the existing air quality in the area and air pollution risks from the development to local receptors.
Environmental agencies in Australia and New Zealand have also identified light scattering instruments as Other Approved Methods for air quality monitoring at construction and demolition sites. The Ministry for the Environment’s Good Practice Guide for Assessing and Managing Dust states that optical instruments can be used for compliance monitoring where their limitations are understood and acknowledged.
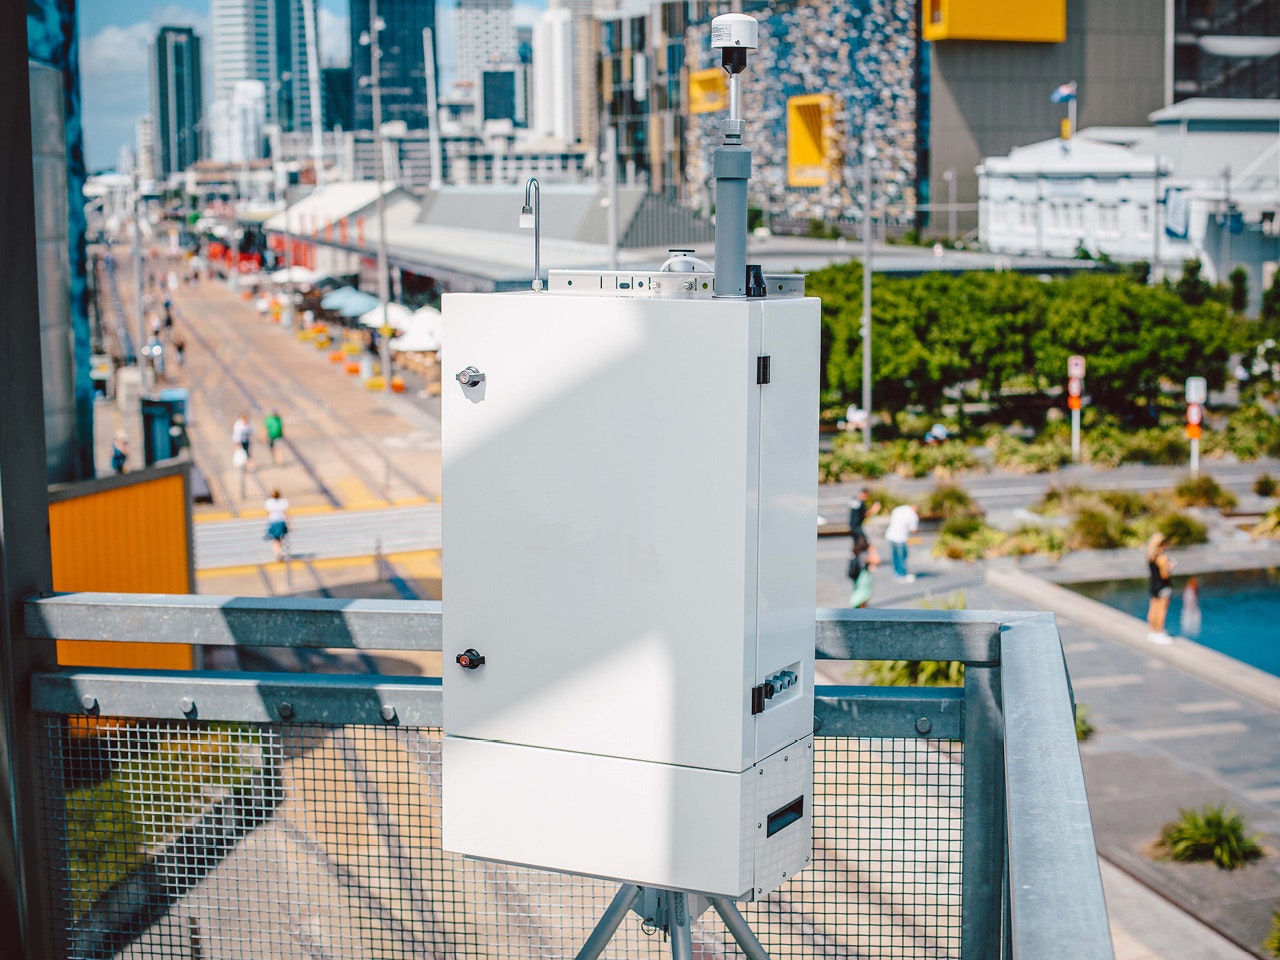
Optical and sensor-based instruments offer significant advantages on construction and demolition sites. They can be easily deployed at the site boundary. Remote real-time monitoring can provide SMS/email trigger alerts and information on effectiveness of mitigation measures. Their minimal requirement for routine service and maintenance is beneficial in construction site environments, and they can be used to identify any periods of unexpectedly high levels of dust. Some analysers offer the capability to combine simultaneous real-time NO2 and PM10 and PM2.5 measurement with wind speed and direction data into a compact integrated system for total source apportionment.
Read the next blog to learn about siting these monitors around a construction environment.
Air monitoring made easy
Take the time and hassle out of your next project with a real-time air quality monitoring solution.