


Blog
Aeroqual AQS: Nitrogen Dioxide, Ozone, VOC and PM available now

Article Details
Last Updated
14 September 2025
Published
01 August 2017
Category
Remediation
Introduction
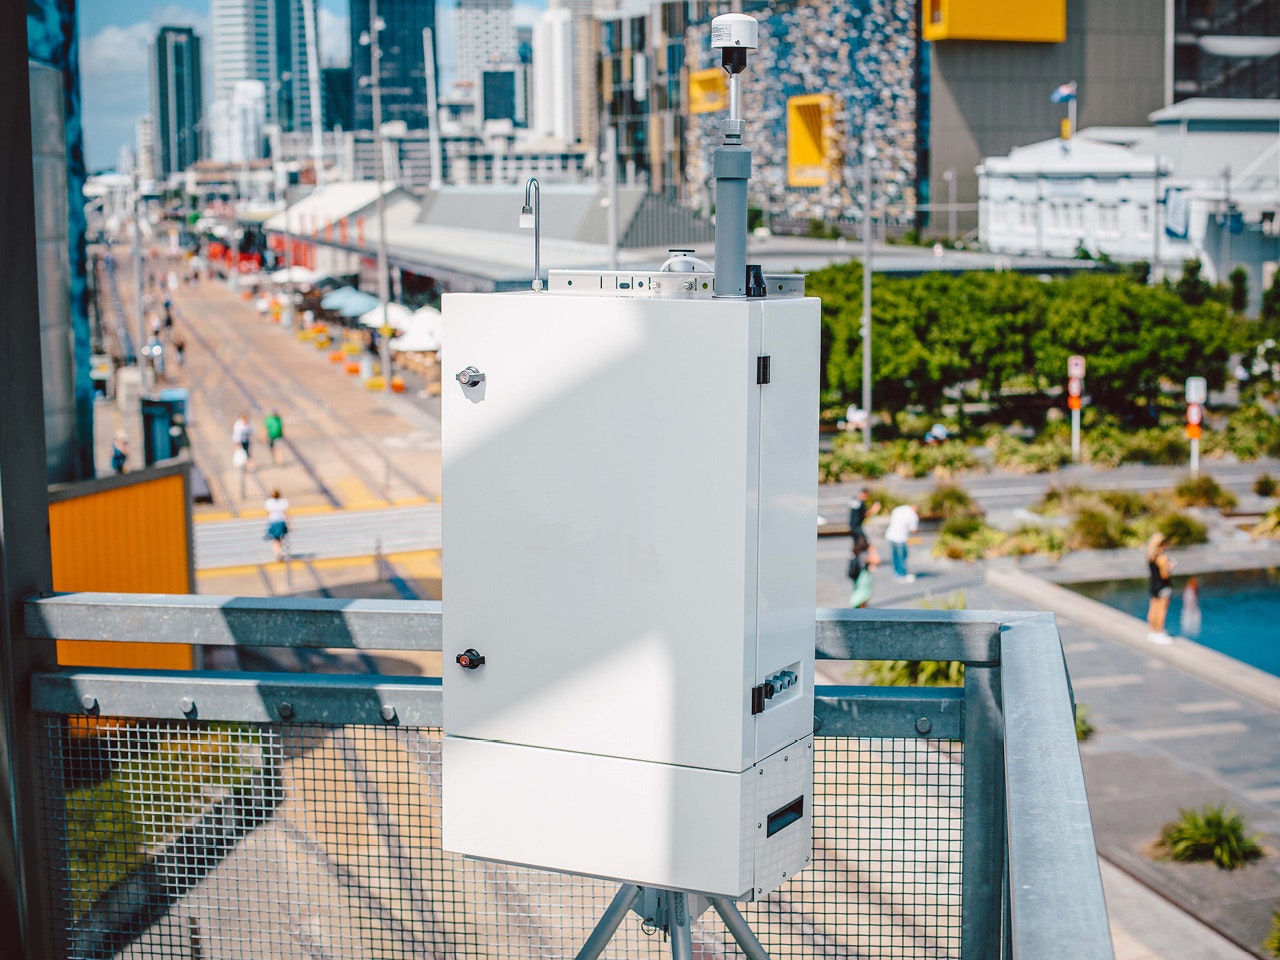
Aeroqual recently introduced the AQS monitoring platform. Smaller, cheaper and lower power than the AQM 65, yet still capable of the same high performance levels, the AQS is expected to broaden the appeal of Aeroqual’s sensor-based monitoring line up.
Nitrogen dioxide, ozone and particulate matter are the three main air pollutants in modern cities. Nitrogen dioxide (NO2) and particulate matter (PM) is emitted directly by vehicles stationery sources and ozone (O3) is created when NO2 and volatile organic compounds (VOCs) combine in the presence of sunlight. The health effects of these pollutants are well-documented.
Combining these measurements on a light weight platform designed for short and long term outdoor monitoring therefore makes a lot of sense. Now air quality professionals have a tool that can help them to measure, map and forecast the key urban air pollutants.
AQS Applications
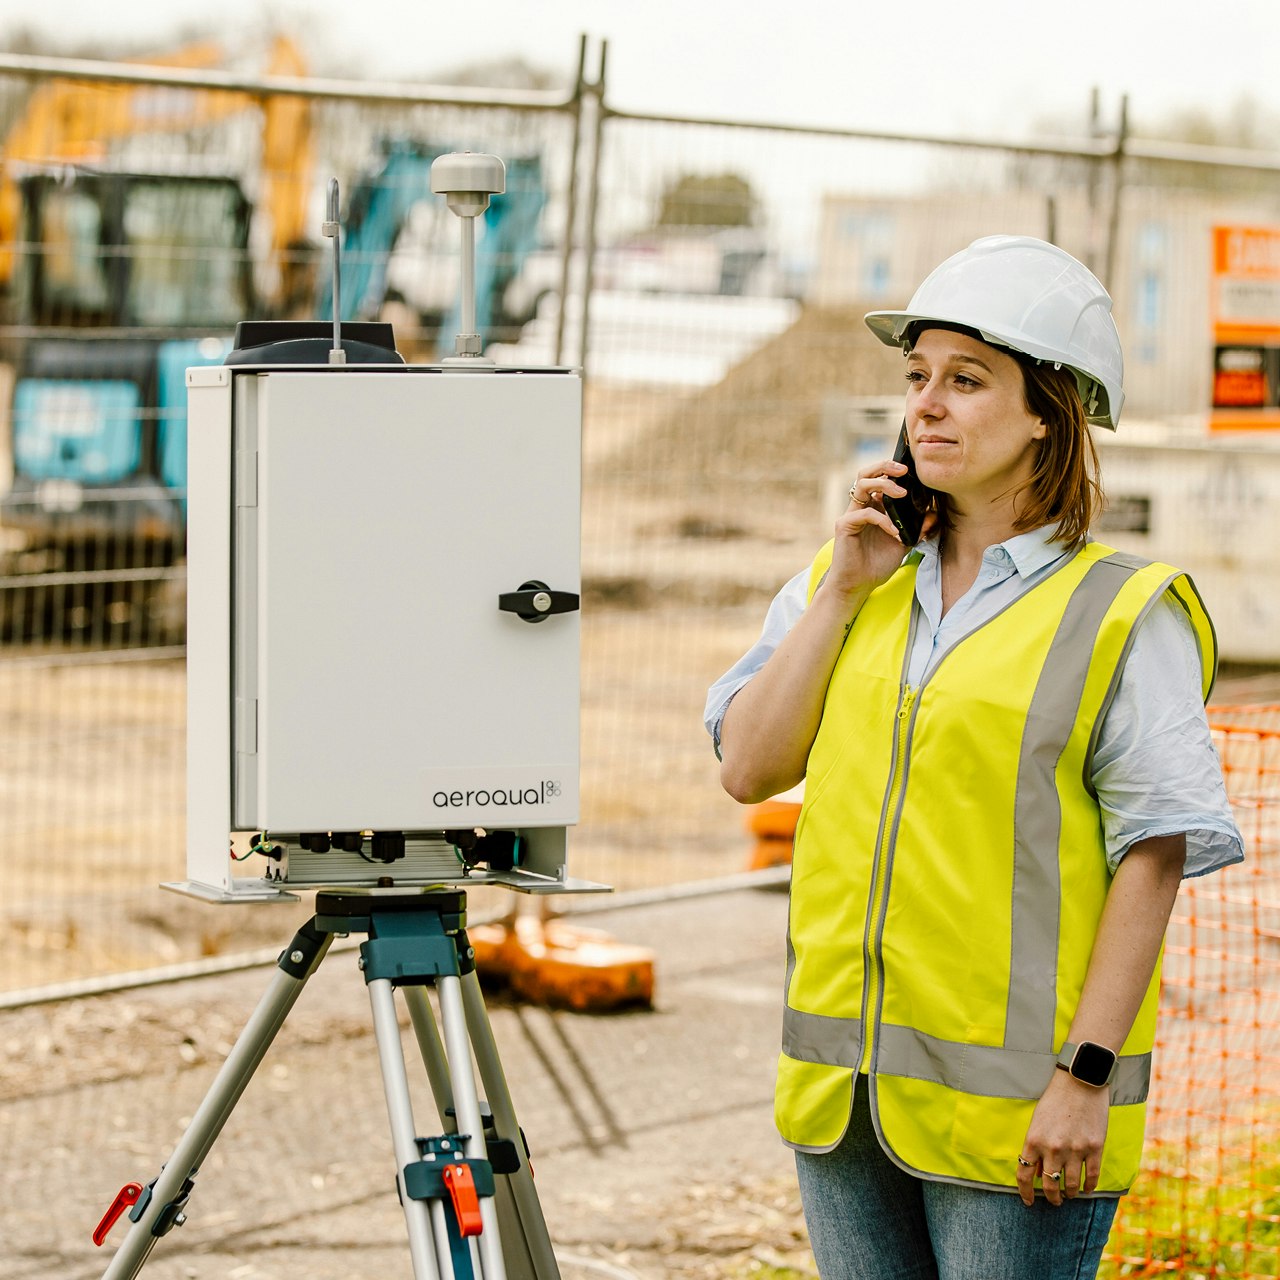
The AQS can be deployed in a network targeting a small area – such as a busy intersection – for a focused period of time, let’s say 3-4 months. Or they can be distributed over a wide area for several years to get a better understanding of long term spatial and temporal trends across a city.
The main applications our customers foresee for the AQS include:
- Construction dust and emissions
- Roadside traffic emissions
- Rail / transport corridor and terminal emissions
- Mapping smog formation and distribution
- Validation of air quality models
- Community exposure studies
- Site remediation emissions
Air quality agencies and consultants in particular have sought a tool that can gather reliable real-time air quality data cost effectively, and the AQS is designed for their requirements.

How is the AQS different?
Compared to traditional methods of gathering urban air quality data, the AQS is radically different. Traditional diffusion tubes may be cost effective and easy to deploy but provide limited temporal resolution with historical data only. Reference analyser stations are highly accurate and provide better temporal resolution, but they are prohibitively expensive to establish and maintain, and their size makes finding suitable monitoring sites difficult in the space constrained urban environment.
The AQS by contrast provides real-time data, transmitted wirelessly direct to the data user or network, is small (the size of a brief case), and costs 10-20 x less than traditional reference analyser stations.
Compared to other sensor based monitors the AQS also has certain advantages that allow it to produce better data for longer periods. These advantages include:
- Pumped sampling system. This provides a steady flow of air to the sensor modules. It also allows for the use of filters which protect the sensors from airborne impurities – therefore extending their operating life.
- Automatic Baseline Correction (ABC). Pioneered in the AQM by Aeroqual, this technique sees the automatic correction of the ‘zero’ baseline every 60 seconds. The technique corrects for cross interferences and sensor drift – two of the biggest problems for sensor-based monitors.
- Interference-free NO2 measurement. Most sensor-based monitors use an electrochemical sensor to measure NO2. The problem is that NO2 electrochemical sensors respond equally to O3, so the sensor output is actually NO2+O3. Professionals want to know exactly how much O3 and NO2 is present and when. We achieve this by using the highly selective Aeroqual ozone sensor to correct for ozone interference on the electrochemical NO2 The technique is patented by Aeroqual.
- Tried and tested PM sensing. A nephelometer made by Met One Instruments and custom-designed for Aeroqual is integrated into the AQS. Compared to low cost optical counters, the Met One nephelometer is robust and proven to last for years in the field. In the AQS the nephelometer is coupled with a pumped sampling system and an inlet heater which corrects for humidity interference.
The technology described above allows the AQS to deliver high quality data for long periods of time with minimal maintenance. In comparison to reference analyzers the AQS has shown R2 correlation as high as 0.98.
AQS vs AQM
Many of our customers want to know what the differences are between the AQM and the AQS. The following provides a quick summary:
AQM 65
- Measures up to six gases and four particulate fractions simultaneously
- Fully temperature controlled enclosure, able to operate from -35°C to +50°C
- Integrated remote field calibration system optional
- Weighs 30 kg
AQS
- Measures up to two gases and four particulate fractions simultaneously
- No temperature control – rated for -10°C to +45°C
- Can be field calibrated by portable calibration equipment
- Weighs < 12.5 kg
As can been seen from the above table if you need to measure six parameters, or you expect extremes of hot and cold, then the AQM is the right choice. If your application requires measurement of fewer gases, and temperature extremes are unlikely then you are best to choose the AQS.
How does the AQS perform?
Extensive field tests have been run in USA, China and New Zealand.
Ozone and PM results are covered in the reports from the China and USA tests. Focusing on the China test results, data capture rates were above 96%. The results show excellent correlation with independently run EPA-approved reference methods. The 1-hour average O3 concentrations measured by the AQS showed excellent correlation with the reference O3 analyzer with an R² = 0.97. The 24-hour average PM2.5 concentrations measured by the AQS also showed a good correlation to the reference PM2.5 instrument with an R² = 0.78.
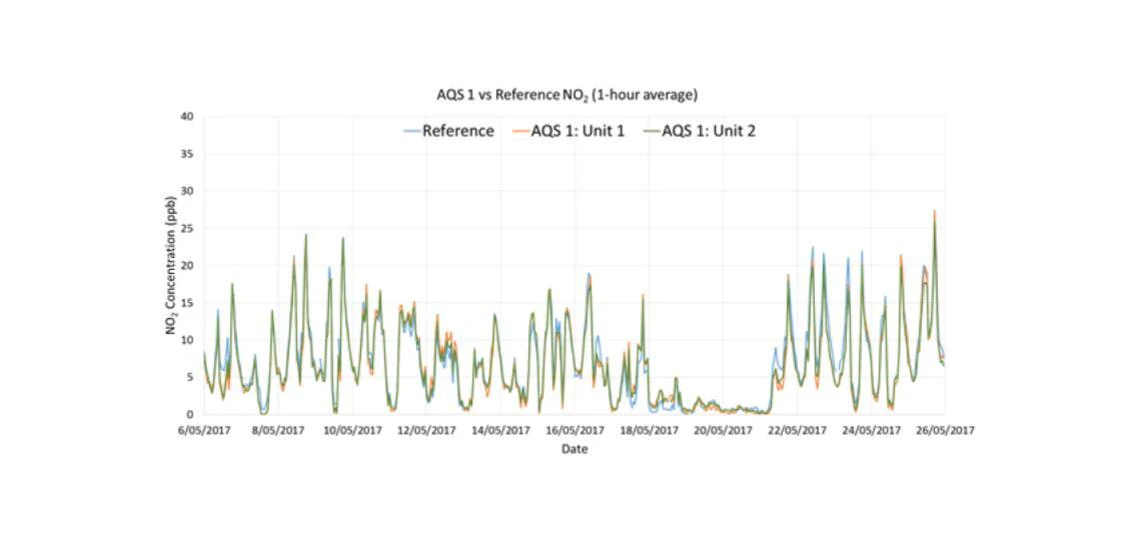
We are still gathering long term NO2 datasets. Initial data is available on request. A snapshot of the data below shows very strong correlation with a US EPA-approved chemiluminescent NOx analyser. Over a 20 day period the AQS NO2 demonstrated R2 correlation of 0.95.
Where can you get one?
Related products

Air monitoring made easy
Take the time and hassle out of your next project with a real-time air quality monitoring solution.