


Case Study
Continuous benzene monitoring aids refinery compliance in the Deep South
Aeroqual’s AQS 1 Benzene continuous fenceline monitoring solution was deployed at a large oil and gas facility to aid compliance with the U.S. EPA’s Refinery Sector Rule.

Project Details
Project
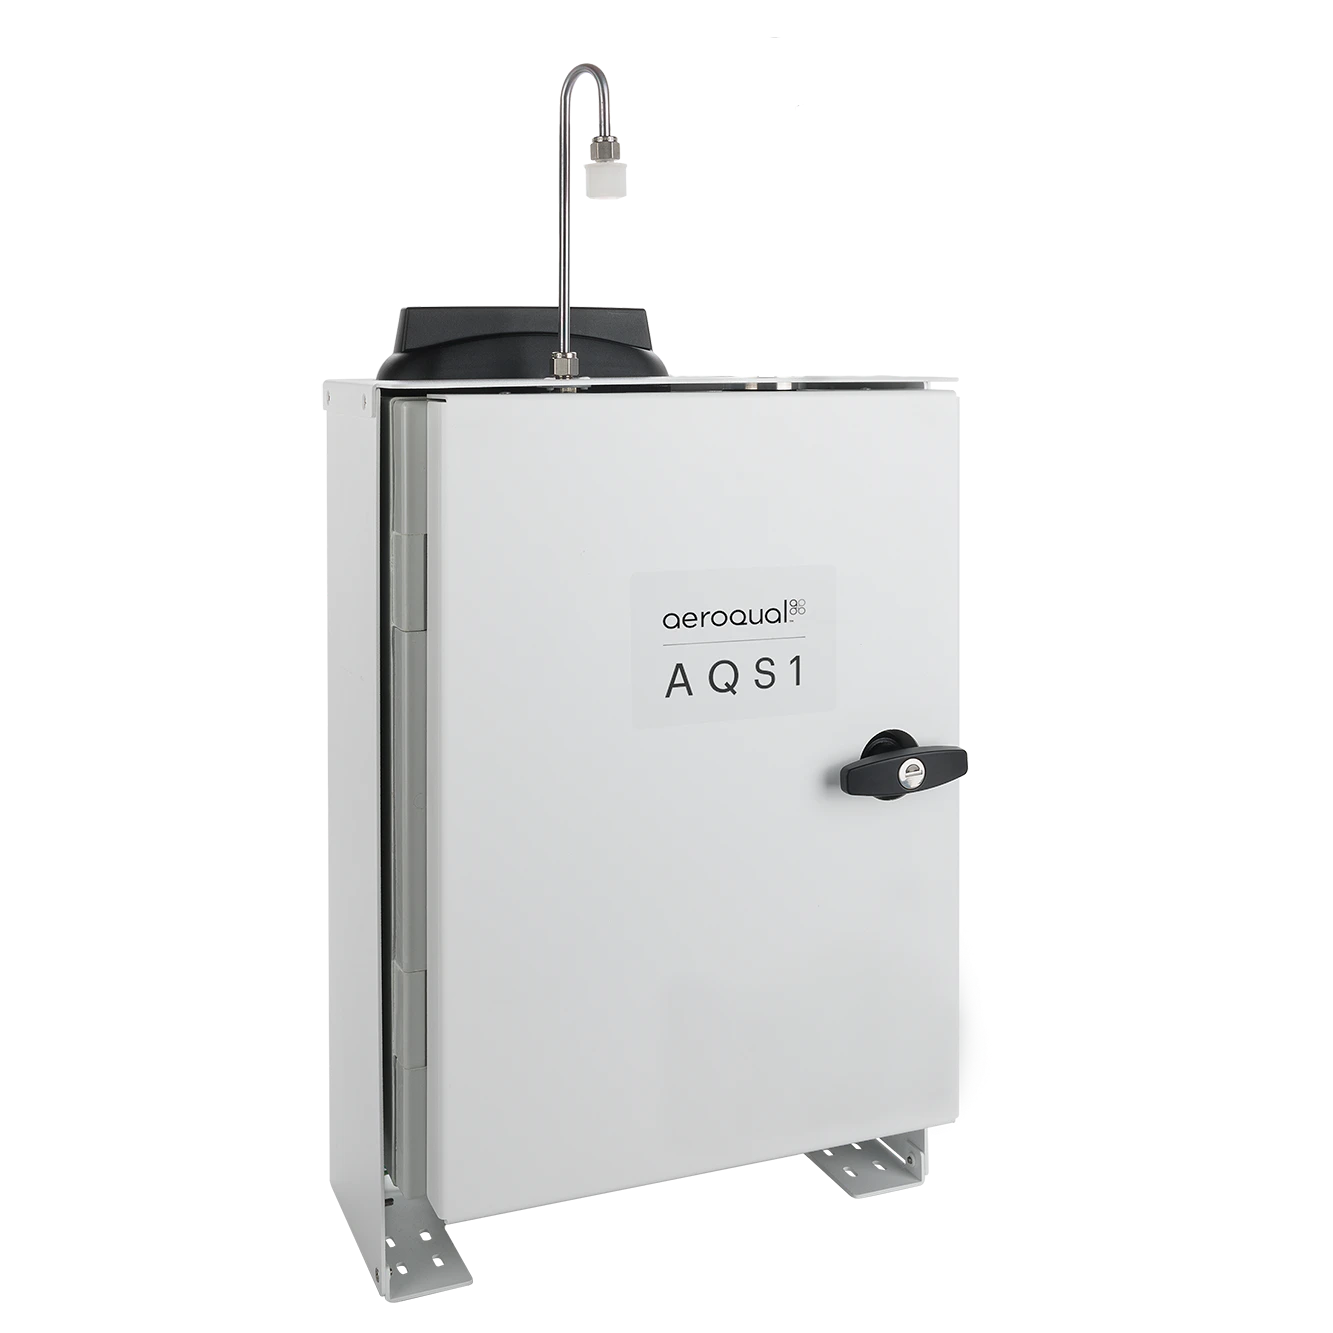
AQS 1 Benzene Refinery Trial
Location
United States
Date
2026
Services
AQS 1 Benzene Air Quality Monitor, Aeroqual Cloud software
Measurements
Benzene, Wind
Sector
Oil & Gas Air Monitoring
Supporting EPA Refinery Sector Rule compliance
An oil and gas facility in the West South Central region of the United States recently decided to trial a continuous benzene monitoring solution alongside its existing passive monitoring program. The facility was already fulfilling its fenceline monitoring obligations under the U.S. EPA’s Petroleum Refinery Sector Rule, which requires operators to collect air samples via passive sampling techniques (such as sorbent tubes) under Method 325.
However, passive sampling of benzene generally involves a two-week collection period, followed by a further delay while samples are sent for lab testing. The operator wanted to explore whether continuous benzene monitoring technology could more quickly identify exceedance events and assist with accurate source localization. For this trial, the operator selected the AQS 1 Benzene Air Quality Monitor.
Project challenges
Selecting an optimal deployment location for the AQS 1 Benzene was an important aspect of the trial. Ready access to mains power is a common challenge for oil and gas facilities seeking to deploy advanced monitoring systems, as most refineries are found in remote areas. In this case, the AQS 1 Benzene’s solar power capabilities allowed the operator to deploy it anywhere around the site. Ultimately, the operator placed the AQS 1 Benzene between the refinery and a product loading facility bordering a nearby wharf, about 200ft from an established passive sampling location.
One of the major drawbacks to using passive sampling as a sole method of measurement is that lab results don’t provide any information to help locate the source of a leak. This makes it more difficult to reverse an exceedance, even once you become aware it’s happening. A two-week passive sampling period further compounds compliance issues, as operators often aren’t notified about a leak until it’s too late. At the trial facility, the operator used a vapor combustion unit during the loading process to prevent the release of benzene and other volatile organic compounds (VOCs). If the operator wanted to quickly determine whether an exceedance originated from the loading area or the refinery itself, lab results alone would not provide a definitive answer. The operator would need to perform a more extensive (and time-consuming) investigation to isolate the source of emissions and take corrective action.
Project outcome
The AQS 1 Benzene was deployed at the facility for a six-week trial period. The solution provided a benzene measurement every 15 minutes, detecting several exceedance events above the EPA Refinery Sector Rule limit of 9 µg/m³. Benzene concentrations across the trial period are shown in Figure 1 below.

Figure 1: Benzene concentrations across the full trial period (left). Further insights on the grey shaded area, including the most severe exceedances (right).
By pairing the AQS 1 Benzene with our Aeroqual Cloud software and meteorological sensors measuring wind speed and direction, the facility operator was able to gather valuable data on the source of these emissions. For example, one exceedance event took place during a period of unusually high winds. The solution used wind speed and direction data to correlate emissions with a product loading event in the wharf area, ruling out a leak at the refinery itself. Other exceedance events were calculated as having occurred during periods of low wind, which can contribute to pollutant accumulation. Further insights on how wind speed and direction impacted benzene concentrations are found in Figure 2 below.

Figure 2: Polar plots showing mean benzene concentrations by wind speed and direction. Shows an association between short-term benzene peaks and winds coming from the loading area (boat). Lower concentrations were typically observed when winds originated from the refinery (west).
The overall data capture rate was >99%, indicating excellent reliability throughout the six-week trial. The senior engineer responsible for deploying the AQS 1 Benzene summed it up as being “very easy to deploy and use”, while also remarking on Aeroqual Cloud’s ability to deliver “useful data analytics” via an easy-to-navigate interface. As a result of this trial, the refinery is actively investigating a more permanent continuous benzene monitoring program. By supplementing passive sampling methods with a continuous monitoring system, the AQS 1 Benzene provides oil and gas facility operators with faster, more localized insights, aiding compliance, protecting sensitive receptors, and saving on overall costs.
Related products

Case Studies

Case Study - Brownfield Redevelopment
Perimeter monitoring during a waterfront stabilization project in Queens
Case Study - Brownfield Redevelopment
Remediating a former industrial site in Los Angeles

Case Study - Brownfield Redevelopment
Building a healthier Brooklyn: Aeroqual and Langan's collaboration on the Alafia Estate
Want to learn more?
If you’d like to know more about this case study, or to discuss your air monitoring requirements, please get in touch.